
Orders in Productionorders
42Demo metrics within the current filterEXAMPLE 03 / BUSINESS DASHBOARDDon't just store the data —
Don't just store the data —
make it legible and traceable for managers
Order, production, inventory and quality metrics in one view, filtered by date and shift; you can read the trends, then expand exception details and check them against the data tables.
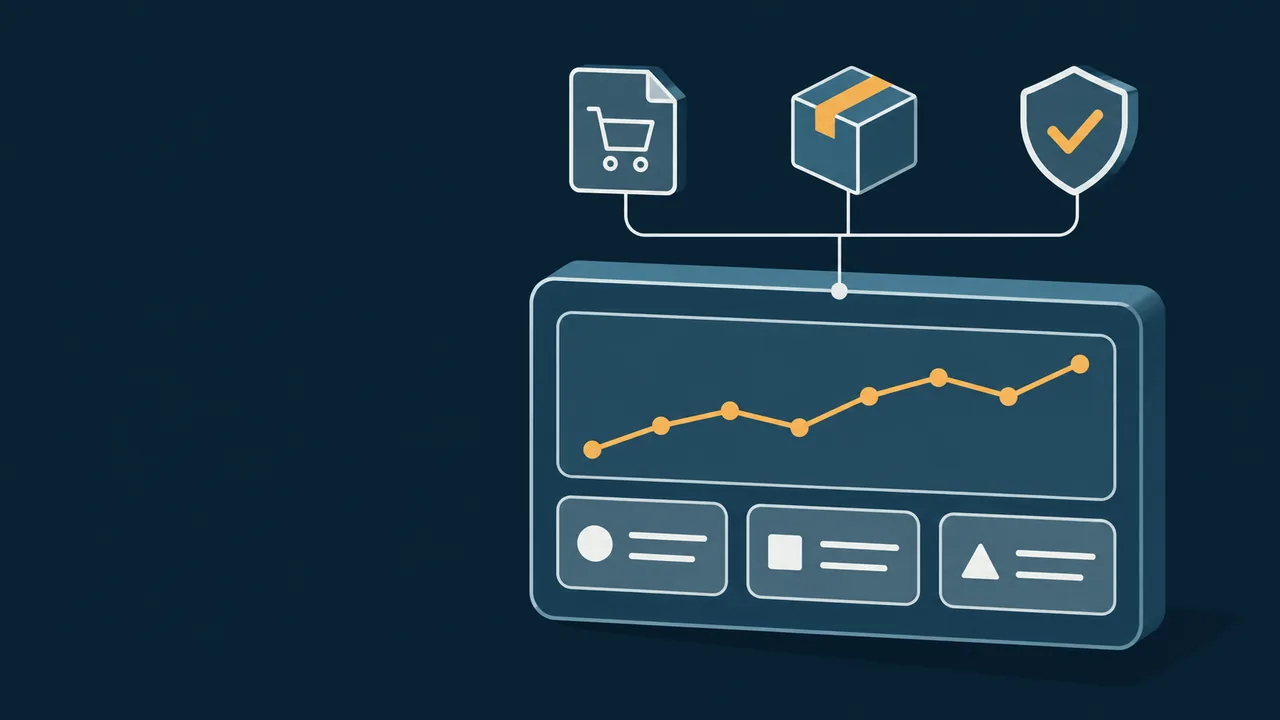
Business & Production CockpitInterface mockup · test data only · metrics do not represent actual business performance
Cumulative Completionspcs
637Matches the completion trend total belowInventory Alertsitems
3Verify materials and warehouses in the detailsInspection Pass RateDemo
97.6%Shows the metric format only; not a guarantee of resultsDaily Completion Trend
Single series · unit: pcs · read via hover or keyboard focus
View the Full Data Table
| Date | Completions |
|---|---|
| 10-30 | 78 pcs |
| 10-31 | 99 pcs |
| 11-01 | 96 pcs |
| 11-02 | 99 pcs |
| 11-03 | 96 pcs |
| 11-04 | 83 pcs |
| 11-05 | 86 pcs |
Exceptions to Watch
Expand to view related business records
All shifts · 2 work orders near dueDue
MO-0142 fine machining has 20 pcs unreported; MO-0149 awaits confirmation of packaging materials. In a production system you can drill down further to operations and owners.
All shifts · 1 material below safety stockInventory
MAT-1105-A available quantity is below the demo safety line. Check in-transit purchases and allocated quantities — don't rely on the stock total alone.
All shifts · 1 inspection sheet awaiting reviewQuality
QC-0142 appearance sampling record submitted, awaiting review by the quality owner; handling deadlines and escalation rules are configured per project.
All filtering and value changes are generated from fixed simulated data in the browser, with no database connection; chart values can also be read via keyboard focus and the full data table.
BEFORE / AFTER
From “building sheets daily” to “one shared view of the business”
Before: data existed, definitions didn't agree
- Orders, production, inventory and quality were tracked in separate sheets by different people
- The same metric was computed differently in different spreadsheets
- After spotting an anomaly, managers had to chase details layer by layer
- Charts took time to build, and data freshness was never guaranteed
After: metrics, charts and details share one source
- Metric definitions for orders, completions, inventory and quality are agreed first
- The same data filtered by unified date, department and shift
- Anomalies trace from charts back to documents and ownership records
- Dashboards and scheduled reports provided per permissions
DELIVERY BOUNDARY
The key to a dashboard project often lies beyond the charts
Can serve as baseline delivery scope
- Agreed data source connections and read-only account setup
- Core business metric definitions and calculation logic confirmed
- Queries, charts, filters and business dashboards
- Exception details, basic permissions and scheduled reports
- Usage training and reconciliation on specified sample data
Requires dedicated governance or expansion
- Source-system historical data cleansing and master data governance
- Unified customer, material and order codes across systems
- Complex real-time streams, second-level refresh and big data platforms
- Custom forecasting, business advice or AI analysis
- Integration with closed software that exposes no database or API
ACCEPTANCE
Accept dashboards by reconciliation, not by colors alone
State the data source, formula, refresh time and owner.
Under the same filters, verify chart, details and source system.
Verify that near-due, shortage or quality anomalies locate the underlying document.
Each role sees only its authorized scope, and export behavior is agreed.